


VChart 中 Tooltip 如何实现多列显示?
问题描述
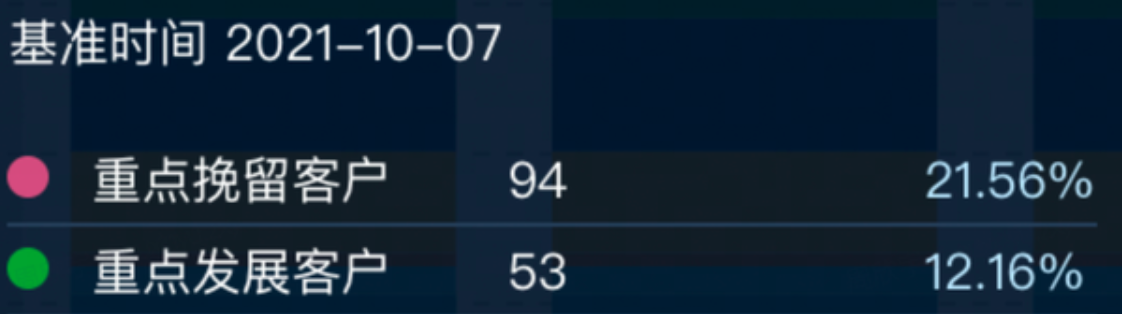
类似 (https://visactor.io/vchart/demo/tooltip/format-method?keyword=tooltip)这样的图表,希望tooltip能格式化成多列
解决方案
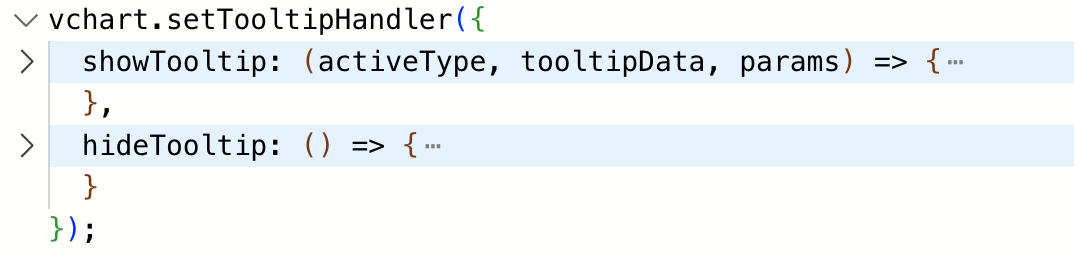
不同图表库的解决方案不一样,根据你给的 demo,在 VChart 中需要通过自定义 tooltip 的功能自行实现 tooltip 的多列样式。
代码示例
const data = [
  { year: '2012', type: 'Forest', value: 320 },
  { year: '2012', type: 'Steppe', value: 220 },
  { year: '2012', type: 'Desert', value: 150 },
  { year: '2012', type: 'Wetland', value: 98 },
  { year: '2013', type: 'Forest', value: 332 },
  { year: '2013', type: 'Steppe', value: 182 },
  { year: '2013', type: 'Desert', value: 232 },
  { year: '2013', type: 'Wetland', value: 77 },
  { year: '2014', type: 'Forest', value: 301 },
  { year: '2014', type: 'Steppe', value: 191 },
  { year: '2014', type: 'Desert', value: 201 },
  { year: '2014', type: 'Wetland', value: 101 },
  { year: '2015', type: 'Forest', value: 334 },
  { year: '2015', type: 'Steppe', value: 234 },
  { year: '2015', type: 'Desert', value: 154 },
  { year: '2015', type: 'Wetland', value: 99 },
  { year: '2016', type: 'Forest', value: 390 },
  { year: '2016', type: 'Steppe', value: 290 },
  { year: '2016', type: 'Desert', value: 190 },
  { year: '2016', type: 'Wetland', value: 40 }
];
const aggregation = {};
data.forEach(({ year, value }) => {
  if (!aggregation[year]) {
    aggregation[year] = 0;
  }
  aggregation[year] += value;
});
const spec = {
  type: 'bar',
  data: [
    {
      id: 'bar',
      values: data
    }
  ],
  xField: ['year', 'type'],
  yField: 'value',
  seriesField: 'type',
  bar: {
    state: {
      legend_hover_reverse: {
        fill: '#ccc'
      }
    }
  },
  legends: {
    visible: true
  },
  tooltip: {
    mark: {
      title: {
        value: datum => datum['year'] + '年'
      },
      content: [
        {
          key: datum => datum['type'],
          value: datum => datum['value']
        },
        {
          hasShape: false,
          key: 'Proportion',
          value: datum => Math.round((datum['value'] / aggregation[datum['year']]) * 10000) / 100 + '%'
        }
      ]
    },
    dimension: {
      title: {
        value: datum => datum['year'] + '年'
      },
      content: [
        {
          key: datum => datum['type'],
          value: datum => datum['value']
        },
        {
          hasShape: false,
          key: datum => datum['type'] + ' Proportion',
          value: datum => Math.round((datum['value'] / aggregation[datum['year']]) * 10000) / 100 + '%'
        }
      ]
    }
  }
};

const vchart = new VChart(spec, { dom: CONTAINER_ID });
vchart.renderSync();

vchart.setTooltipHandler({
  showTooltip: (activeType, tooltipData, params) => {
    // some code of custom tooltip
    let tooltip = document.getElementById('custom-tooltip');
    console.log(params);
    if (!tooltip) {
      tooltip = document.createElement('div');
      tooltip.id = 'custom-tooltip';
      document.getElementById(CONTAINER_ID).appendChild(tooltip);
      const title = document.createElement('p');
      title.id = 'custom-tooltip-title';
      title.style['fontWeight'] = 'bolder';
      tooltip.appendChild(title);
      const content = document.createElement('div');
      content.id = 'custom-tooltip-content';
      content.style.display = 'flex';
      content.style.flexDirection = 'row';
      tooltip.appendChild(content);
      const leftC = document.createElement('div');
      leftC.style.display = 'flex';
      leftC.style.flexDirection = 'column';
      leftC.style.justifyContent = 'center';
      const s = document.createElement('div');
      s.id = 'custom-tooltip-symbol';
      s.style.width = '10px';
      s.style.height = '10px';
      leftC.appendChild(s);
      const rightC = document.createElement('div');
      rightC.style.width = '200px';
      rightC.style.display = 'flex';
      rightC.style.justifyContent = 'space-around';
      content.appendChild(leftC);
      content.appendChild(rightC);
      const r1 = document.createElement('div');
      r1.id = 'custom-tooltip-r1';
      const r2 = document.createElement('div');
      r2.id = 'custom-tooltip-r2';
      const r3 = document.createElement('div');
      r3.id = 'custom-tooltip-r3';
      r3.style.color = 'grey';
      rightC.appendChild(r1);
      rightC.appendChild(r2);
      rightC.appendChild(r3);
    }

    if (!tooltip || activeType !== 'mark') return;
    const datum = tooltipData[0].datum[0];
    const series = tooltipData[0].series;
    console.log(activeType, tooltipData, params, datum);
    tooltip.style.visibility = 'visible';
    tooltip.style.left = params.event.x + 20 + 'px';
    tooltip.style.top = params.event.y + 20 + 'px';
    tooltip.style.position = 'absolute';
    tooltip.style.background = 'white';
    tooltip.style.padding = '10px';
    const title = document.getElementById('custom-tooltip-title');
    title.innerText = datum['year'] + '年';
    const s = document.getElementById('custom-tooltip-symbol');
    s.style.background = series.getSeriesStyle(datum)('fill');
    const r1 = document.getElementById('custom-tooltip-r1');
    const r2 = document.getElementById('custom-tooltip-r2');
    const r3 = document.getElementById('custom-tooltip-r3');
    r1.innerText = datum['type'];
    r2.innerText = Math.round((datum['value'] / aggregation[datum['year']]) * 10000) / 100 + '%';
    r3.innerText = datum['value'];
  },
  hideTooltip: () => {
    // hide your custom tooltip
    const tooltip = document.getElementById('custom-tooltip');
    if (!tooltip) return;
    tooltip.style.visibility = 'hidden';
  }
});

// Just for the convenience of console debugging, DO NOT COPY!
window['vchart'] = vchart;
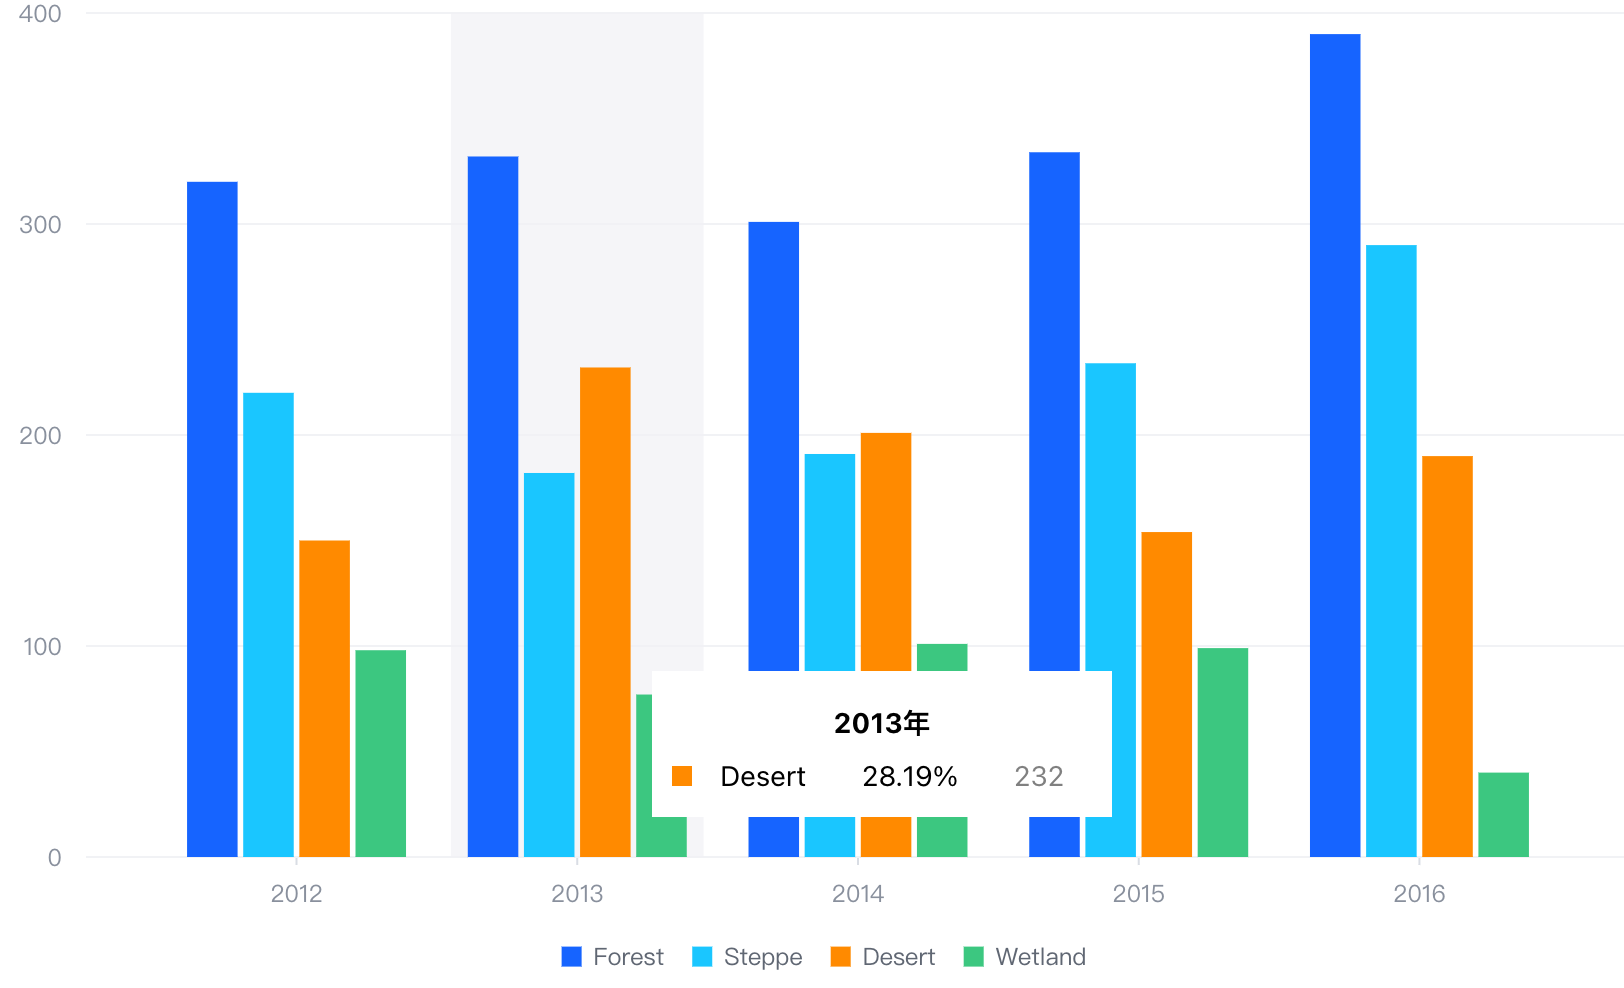
结果展示
在线效果参考:https://codesandbox.io/s/tooltip-multicolumn-j9s8x7
相关文档
Tooltip 教程:https://visactor.io/vchart/guide/tutorial_docs/Chart_Concepts/Tooltip 相关 api:https://visactor.io/vchart/option/barChart#tooltip.visible github:https://github.com/VisActor/VChart